Max Temperature
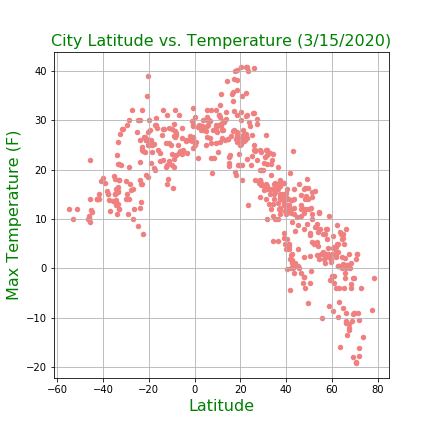
This graph shows the relationship between temperature and latitude. As expected, the weather becomes warmer as it approaches the equator. Also, the plot shows that the equator and regions close to the equator tend to be warmer this time of the year.


